Archivo:CrossCorr Pulse.png

Tamaño de esta previsualización: 601 × 600 píxeles. Otras resoluciones: 240 × 240 píxeles · 481 × 480 píxeles · 769 × 768 píxeles · 1125 × 1123 píxeles.
Ver la imagen en su resolución original (1125 × 1123 píxeles; tamaño de archivo: 156 kB; tipo MIME: image/png)
Historial del archivo
Haz clic sobre una fecha y hora para ver el archivo tal como apareció en ese momento.
| Fecha y hora | Miniatura | Dimensiones | Usuario | Comentario | |
|---|---|---|---|---|---|
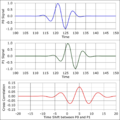
| actual | 03:52 13 jun 2015 |  | 1125 × 1123 (156 kB) | TinyPebble | Fixed a math error and regenerated the graphs. The previous version had a time shift near 3 time units between P0 and P1 and the peak in cross correlation = 5. The new graphs now correctly show the P0 to P1 time shift = 5. |
| 02:30 17 mar 2010 |  | 1350 × 1350 (136 kB) | TinyPebble | {{Information |Description={{en|1=P0 is an example of a pulse time series signal. The time units are arbitrary. It was produced with the function exp(-T^2/w) * sin(). P1 is P0 shifted to the Right by 5. Bottom graph is the cross correlation of P0 and P1 s |
Usos del archivo
La siguiente página usa este archivo:
Uso global del archivo
Las wikis siguientes utilizan este archivo:
- Uso en en.wiki.x.io
- Uso en fr.wiki.x.io
- Uso en pl.wiki.x.io
