\[Lambda]random = {};
Do[m = 1/2 (RandomVariate[NormalDistribution[0, 1], {2, 2}] + I RandomVariate[NormalDistribution[0, 1], {2, 2}]);
  AppendTo[\[Lambda]random, Eigenvalues[m]]; , {1000}];
\[Lambda]ortho = {};
Do[m = 1/2 (RandomVariate[NormalDistribution[0, 1], {2, 2}] + I RandomVariate[NormalDistribution[0, 1], {2, 2}]);
  m = Orthogonalize[m]; AppendTo[\[Lambda]ortho, Eigenvalues[m]]; , {1000}];
\[Lambda]symp = {};
Do[m = 1/2 (RandomVariate[NormalDistribution[0, 1], {2, 2}] + I RandomVariate[NormalDistribution[0, 1], {2, 2}]);
  m = m/Sqrt[Det[m]]; AppendTo[\[Lambda]symp, Eigenvalues[m]]; , {1000}];
\[Lambda]herm = {};
Do[m = 1/2 (RandomVariate[NormalDistribution[0, 1], {2, 2}] + I RandomVariate[NormalDistribution[0, 1], {2, 2}]);
  m = (m + ConjugateTranspose[m])/2; AppendTo[\[Lambda]herm, Eigenvalues[m]]; , {1000}];
step[t_] := Ceiling[1000*t^2]
p0 = Table[
   GraphicsGrid[{{
      ListPlot[
       Evaluate[{Re[#], Im[#]} & /@ Flatten[\[Lambda]random[[1 ;; step[t]]] ] ], PlotRange -> {{-3, 3}, {-3, 3}}, AspectRatio -> 1, AxesStyle -> {Black, Thick}, PlotMarkers -> {Graphics[{Orange, Disk[], Black, Circle[]}], 0.03 }, AxesLabel -> {"Re[\[Lambda]]", "Im[\[Lambda]]"}, LabelStyle -> {Black, Bold}, AxesStyle -> Black, PlotLabel -> "Gaussian noise"]
      ,
      ListPlot[
       Evaluate[{Re[#], Im[#]} & /@ Flatten[\[Lambda]ortho[[1 ;; step[t]]]] ], PlotRange -> {{-1.3, 1.3}, {-1.3, 1.3}}, AspectRatio -> 1, AxesStyle -> {Black, Thick}, PlotMarkers -> {Graphics[{Orange, Disk[], Black, Circle[]}], 0.03 }, AxesLabel -> {"Re[\[Lambda]]", "Im[\[Lambda]]"}, LabelStyle -> {Black, Bold}, AxesStyle -> Black, PlotLabel -> "Orthogonal/Unitary"]
      }, {
      ListPlot[
       Evaluate[{Re[#], Im[#]} & /@ Flatten[\[Lambda]herm[[1 ;; step[t]]]] ], PlotRange -> {{-3, 3}, {-3, 3}}, AspectRatio -> 1, AxesStyle -> {Black, Thick}, PlotMarkers -> {Graphics[{Orange, Disk[], Black, Circle[]}], 0.03 }, AxesLabel -> {"Re[\[Lambda]]", "Im[\[Lambda]]"}, LabelStyle -> {Black, Bold}, AxesStyle -> Black, PlotLabel -> "Symmetric/Hermitian"]
      ,
      ListPlot[
       Evaluate[{Re[#], Im[#]} & /@ Flatten[\[Lambda]symp[[1 ;; step[t]]]] ], PlotRange -> {{-3, 3}, {-3, 3}}, AspectRatio -> 1, AxesStyle -> {Black, Thick}, PlotMarkers -> {Graphics[{Orange, Disk[], Black, Circle[]}], 0.03 }, AxesLabel -> {"Re[\[Lambda]]", "Im[\[Lambda]]"}, LabelStyle -> {Black, Bold}, AxesStyle -> Black, PlotLabel -> "Symplectic"]
      }}, ImageSize -> 800]
   , {t, 0.0001, 1, 0.01}];
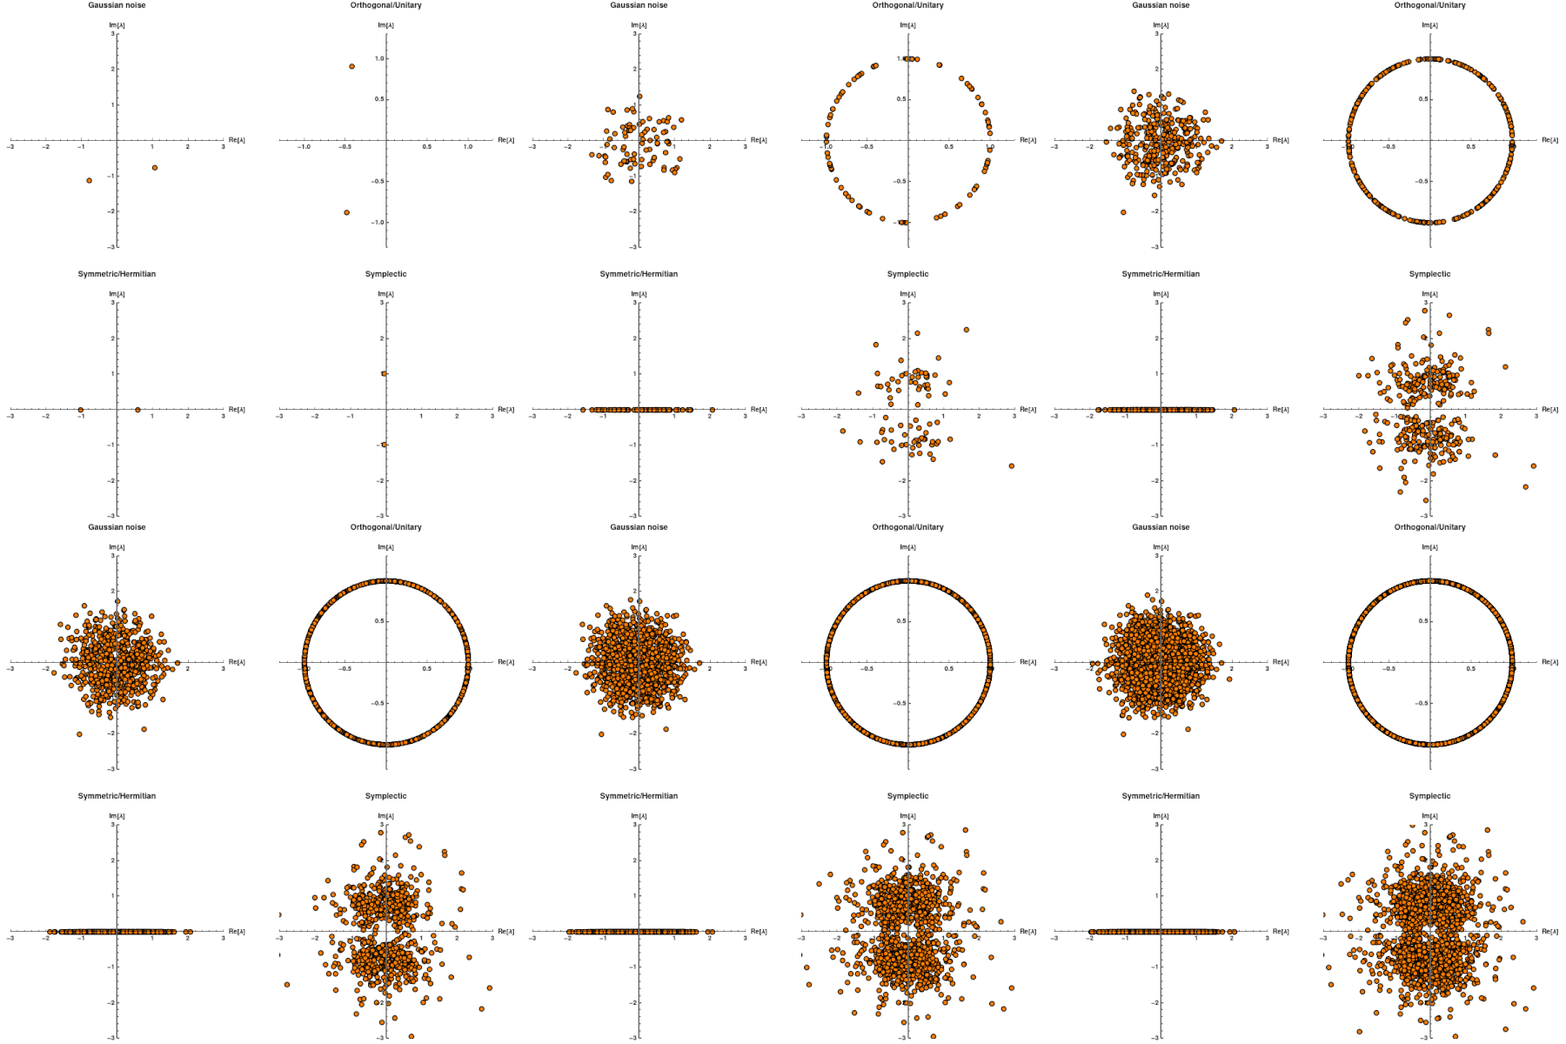
ListAnimate[p0]

