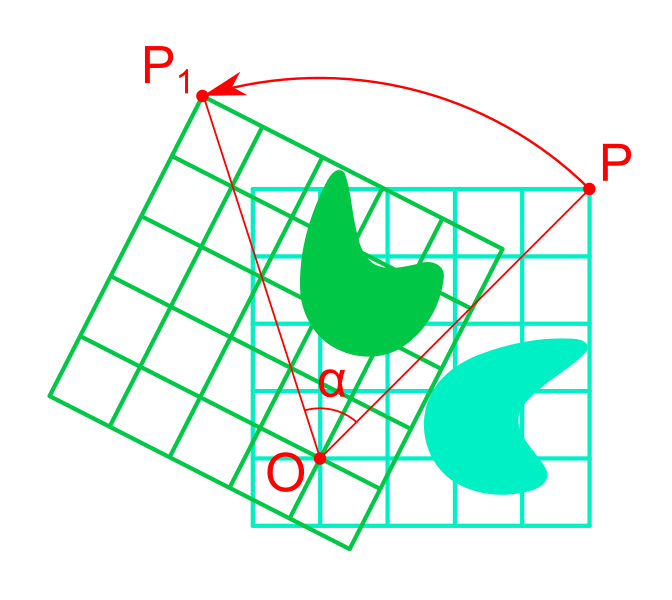
Archivo:Rotation illustration2.svg
Ver la imagen en su resolución original ((Imagen SVG, nominalmente 1005 × 897 pixels, tamaño de archivo: 12 kB))

Resumen

Descripción Illustration of Rotation (mathematics)
Fecha
Fuente self-made, with MATLAB, then tweaked with Inkscape
Autor Oleg Alexandrov
SVG desarrollo
InfoField
 
El código fuente de esta imagen SVG es inválido por 5 errores.
 
Este diagrama, inválido según el W3C, fue creado con una desconocida SVG herramienta

Licencia

Public domain Yo, el titular de los derechos de autor de esta obra, lo libero al dominio público. Esto aplica en todo el mundo.
En algunos países esto puede no ser legalmente factible; si ello ocurriese:
Concedo a cualquier persona el derecho de usar este trabajo para cualquier propósito, sin ningún tipo de condición al menos que éstas sean requeridas por la ley.

Source code (MATLAB)

function main()

% prepare the screen
   figure(1); clf; hold on; axis equal;  axis off; 
   linewidth=2; fs= 30;

   N = 11;
   a = -2; b = N+a-1;
   blue = [0, 0, 1];
   red = [1, 0, 0];
   gray=[0.7, 0.7, 1.0];
   white = 0.99*[1, 1, 1];
   lightblue=[176, 196,222]/256;
   green = [0, 200,  70]/256;
   color1 = gray;
   color2 = green;

   XX = linspace(a, b, N); YY = XX;
   [X, Y] = meshgrid(XX, YY);

   factor = 4; shift = 3.6;
   x=factor*[0, 0.7, 0.5 1, 0]+shift; y=factor*[0, 0, 0.5, 1 0.8];
   do_plot(x, y, X, Y, linewidth, color1);

   theta=1.4*pi/4; A=[cos(theta) -sin(theta); sin(theta) cos(theta)];
   for i=1:N
	  for j=1:N
		 v= A*[X(i, j); Y(i, j)]; X(i, j)=v(1); Y(i, j)=v(2);
	  end
   end
   for i=1:length(x)
	  v= A*[x(i); y(i)]; x(i)=v(1); y(i)=v(2); 
   end

   do_plot(x, y, X, Y, linewidth, color2);

% plot the point around which the rotation takes place
   ball_radius = 0.15;
   ball(0, 0, ball_radius, red);
   text(0, -0.5, '{\it O}', 'color', red, 'fontsize', fs)

% plot the arrow suggesting the rotation
   factor = 4;
   x=factor*1.7; y=factor*2.1; r=sqrt(x^2+y^2); thetas=atan2(y, x);
   thetae=0.7*theta+thetas;
   Theta=thetas:0.01:thetae; X=r*cos(Theta); Y=r*sin(Theta);
   plot(X, Y, 'linewidth', linewidth, 'color', red)
   n=length(Theta);
   arrow([X(n-2), Y(n-2)], [2*X(n)-X(n-1), 2*Y(n)-Y(n-1)], linewidth, 1, 30, linewidth, red)

% plot two invisible points, to bypass a saving bug
   plot(a, 1.5*b, 'color', white); 
   plot(a, -0.5*b, 'color', white); 

% save to eps and to svg
%saveas(gcf, 'rotation_illustration2.eps', 'psc2') 
   plot2svg('rotation_illustration2.svg')

function do_plot(x, y, X, Y, linewidth, color)
   n=length(x); 
   P=5; Q=n+2*P+1; % P will denote the amount of overlap

% Make the 'periodic' sequence xp=[x(1) x(2) x(3) ... x(n) x(1) x(2) x(3) ... ]
% of length Q. Same for yp.
   for i=1:Q
	  j=rem(i, n)+1; % rem() is the remainder of division of i by n
	  xp(i)=x(j);
	  yp(i)=y(j);
   end

% do the spline interpolation
   t=1:length(xp);
   N=100; % how fine to make the interpolation
   tt=1:(1/N):length(xp);
   xx=spline(t, xp, tt);
   yy=spline(t, yp, tt);

% discard the redundant pieces
   start=N*(P-1)+1;
   stop=N*(n+P-1)+1;
   xx=xx(start:stop); 
   yy=yy(start:stop);

   H=fill(xx, yy, color);

   set(H, 'linewidth', 1, 'edgecolor', color);

   [M, N]= size(X);
   for i=1:N
	  plot([X(1, i), X(N, i)], [Y(1, i), Y(N, i)], 'linewidth', linewidth, 'color', color)
	  plot([X(i, 1), X(i, N)], [Y(i, 1), Y(i, N)], 'linewidth', linewidth, 'color', color)
   end

% plot some balls, avoid artifacts at the corners
   small_rad=0.045;
   ball(X(1, 1), Y(1, 1), small_rad, color)
   ball(X(1, N), Y(1, N), small_rad, color)
   ball(X(N, 1), Y(N, 1), small_rad, color)
   ball(X(N, N), Y(N, N), small_rad, color)

function arrow(start, stop, th, arrow_size, sharpness, arrow_type, color)
   
% Function arguments:
% start, stop:  start and end coordinates of arrow, vectors of size 2
% th:           thickness of arrow stick
% arrow_size:   the size of the two sides of the angle in this picture ->
% sharpness:    angle between the arrow stick and arrow side, in degrees
% arrow_type:   1 for filled arrow, otherwise the arrow will be just two segments
% color:        arrow color, a vector of length three with values in [0, 1]
   
% convert to complex numbers
   i=sqrt(-1);
   start=start(1)+i*start(2); stop=stop(1)+i*stop(2);
   rotate_angle=exp(i*pi*sharpness/180);

% points making up the arrow tip (besides the "stop" point)
   point1 = stop - (arrow_size*rotate_angle)*(stop-start)/abs(stop-start);
   point2 = stop - (arrow_size/rotate_angle)*(stop-start)/abs(stop-start);

   if arrow_type==1 % filled arrow

% plot the stick, but not till the end, looks bad
      t=0.5*arrow_size*cos(pi*sharpness/180)/abs(stop-start); stop1=t*start+(1-t)*stop;
      plot(real([start, stop1]), imag([start, stop1]), 'LineWidth', th, 'Color', color);

% fill the arrow
      H=fill(real([stop, point1, point2]), imag([stop, point1, point2]), color);
      set(H, 'EdgeColor', 'none')
      
   else % two-segment arrow
      plot(real([start, stop]), imag([start, stop]),   'LineWidth', th, 'Color', color); 
      plot(real([point1, stop, point2]), imag([point1, stop, point2]), 'LineWidth', th, 'Color', color);
   end

function ball(x, y, radius, color) % draw a ball of given uniform color 
   Theta=0:0.1:2*pi;
   X=radius*cos(Theta)+x;
   Y=radius*sin(Theta)+y;
   H=fill(X, Y, color);
   set(H, 'EdgeColor', color);

Leyendas

Añade una explicación corta acerca de lo que representa este archivo

Elementos representados en este archivo

representa a

image/svg+xml

Historial del archivo

Haz clic sobre una fecha y hora para ver el archivo tal como apareció en ese momento.

(recientes · primeras) Ver (10 siguientes · ) (10 · 20 · 50 · 100 · 250 · 500).
Fecha y horaMiniaturaDimensionesUsuarioComentario
actual09:57 8 dic 2019Miniatura de la versión del 09:57 8 dic 20191005 × 897 (12 kB)Andrew Pertsevfont «O»
09:52 8 dic 2019Miniatura de la versión del 09:52 8 dic 20191005 × 897 (12 kB)Andrew Pertsevcolor
09:45 8 dic 2019Miniatura de la versión del 09:45 8 dic 20191005 × 897 (12 kB)Andrew Pertsevclean, add param, file size
10:16 6 dic 2019Miniatura de la versión del 10:16 6 dic 20191005 × 897 (19 kB)Andrew Pertsevcrop corr
10:14 6 dic 2019Miniatura de la versión del 10:14 6 dic 2019980 × 859 (19 kB)Andrew Pertsevcrop
10:08 6 dic 2019Miniatura de la versión del 10:08 6 dic 2019930 × 859 (19 kB)Andrew Pertsevdownload error correction
09:52 6 dic 2019Miniatura de la versión del 09:52 6 dic 2019930 × 847 (20 kB)Andrew Pertsevsvg optimization file size, arrow corrrction
03:36 11 jun 2007Miniatura de la versión del 03:36 11 jun 2007875 × 758 (47 kB)Oleg Alexandrovtweak
05:24 10 jun 2007Miniatura de la versión del 05:24 10 jun 2007875 × 758 (47 kB)Oleg AlexandrovTweak.
05:55 9 jun 2007Miniatura de la versión del 05:55 9 jun 2007875 × 874 (40 kB)Oleg Alexandrovtweak
(recientes · primeras) Ver (10 siguientes · ) (10 · 20 · 50 · 100 · 250 · 500).

La siguiente página usa este archivo:

Uso global del archivo

Las wikis siguientes utilizan este archivo:

Metadatos